Surface Water Management

Summerhill Waste Management Centre occupies two adjacent creek valleys comprising the Wentworth Creek and Flaggy Creek catchments. Both creeks flow northwards from the site and ultimately discharge to Hexham Wetland. A number of stormwater quality ponds have been established on the natural site drainage lines and all surface water from disturbed areas passes through at least one pond prior to leaving the site.
The main factors that have the potential to influence the quality of surface water discharged from the site include the amount and intensity of rainfall, the amount of disturbed vegetation or ground cover, natural seepage of more saline groundwater and potential escape of leachate.
Measures employed to prevent impacts on surface water quality due to site operations include:
- Installation of a leachate collection and disposal system to prevent cross-contamination with stormwater
- Diversion of clean stormwater runoff around any waste disposal or stockpile areas to sedimentation ponds
- Minimising the tipface to 4 x 25m during opening hours to reduce the potential for contact with stormwater
- Bunding below any active tipface to capture rain which has come into contact with waste and redirect it to the leachate system
- Full covering of the tipface at the completion of each day to prevent contact with stormwater after hours
- Undercover bunded storage for all chemical waste in a purpose-built Chemical Recycling Centre
- Indoor bunded storage for site fuel stores
- Indoor sorting of waste in a purpose built Resource Recovery Centre
- Biofilter medium installed at the Garden Waste Processing Area to treat any runoff
- Maintenance of erosion and sedimentation control measures
- Stormwater treatment to reduce sediment load
- Onsite reuse of stormwater for dust suppression to maintain pond capacity and reduce offsite discharges
- Mandatory wheelwash during wet weather; and
- Road sweeping and washing program
Surface water monitoring

A surface water monitoring program was established onsite in 1991, prior to the Centre opening, to characterise background water quality and to assess the potential impacts once site operations commenced. Monitoring results are promptly interrogated to ensure any necessary notification, investigation or remediation occurs.
Condition M2 of the site's EPL requires five sampling locations be tested for water quality. Four of these locations are situated at the discharge points on site, and one is located downstream and offsite. Monitoring points are listed below and presented on the Environmental Monitoring Location Map.
- SW55 – Onsite water quality pond downstream of the Former Building and Demolition Waste (FBDW) site
- SW56 – Onsite water quality pond downstream of the General Solid Waste (Putrescible) (GSWP) landfill cells
- SW57 – Onsite water quality pond downstream of the General Solid Waste (Non-Putrescible) (GSWNP) landfill
- SW58a – Offsite point located in Wentworth Creek, upstream of Minmi Road but downstream of SW56
- SW59 - Onsite water quality pond downstream of stockpiling areas
A number of other internal water management ponds were added to the monitoring schedule and are tested annually. Testing of these ponds is voluntary and for operational management purposes only as they are not licensed discharge locations.
Council has developed a comprehensive sampling and testing program designed to be to practical and proactive in managing the risk of impacts to surface water. This forms part of an overall review of stormwater design and management at Summerhill and comprises:
- Sampling at all EPL specified sites at least quarterly and daily during discharge wherever possible.
- Treating high TSS risk ponds; Pond 3 and Pond 8 (SW56 and SW59) to reduce TSS, followed by pre-discharge water quality testing and an approval process.
- Daily sampling during any planned treat & discharge from ponds plus the downstream location SW58a.
- Ongoing re-assessment of pond risk rankings based on water quality results
The EPL specifies a short range of parameters for analysis however, SWMC voluntarily tests for a longer range to measure for non-landfilling related impacts such as hard surface runoff, wheel wash discharge, water treatment activities, fuel storage and dispensing. Algae biovolume is also tested as a bio-indicator of potential impact.
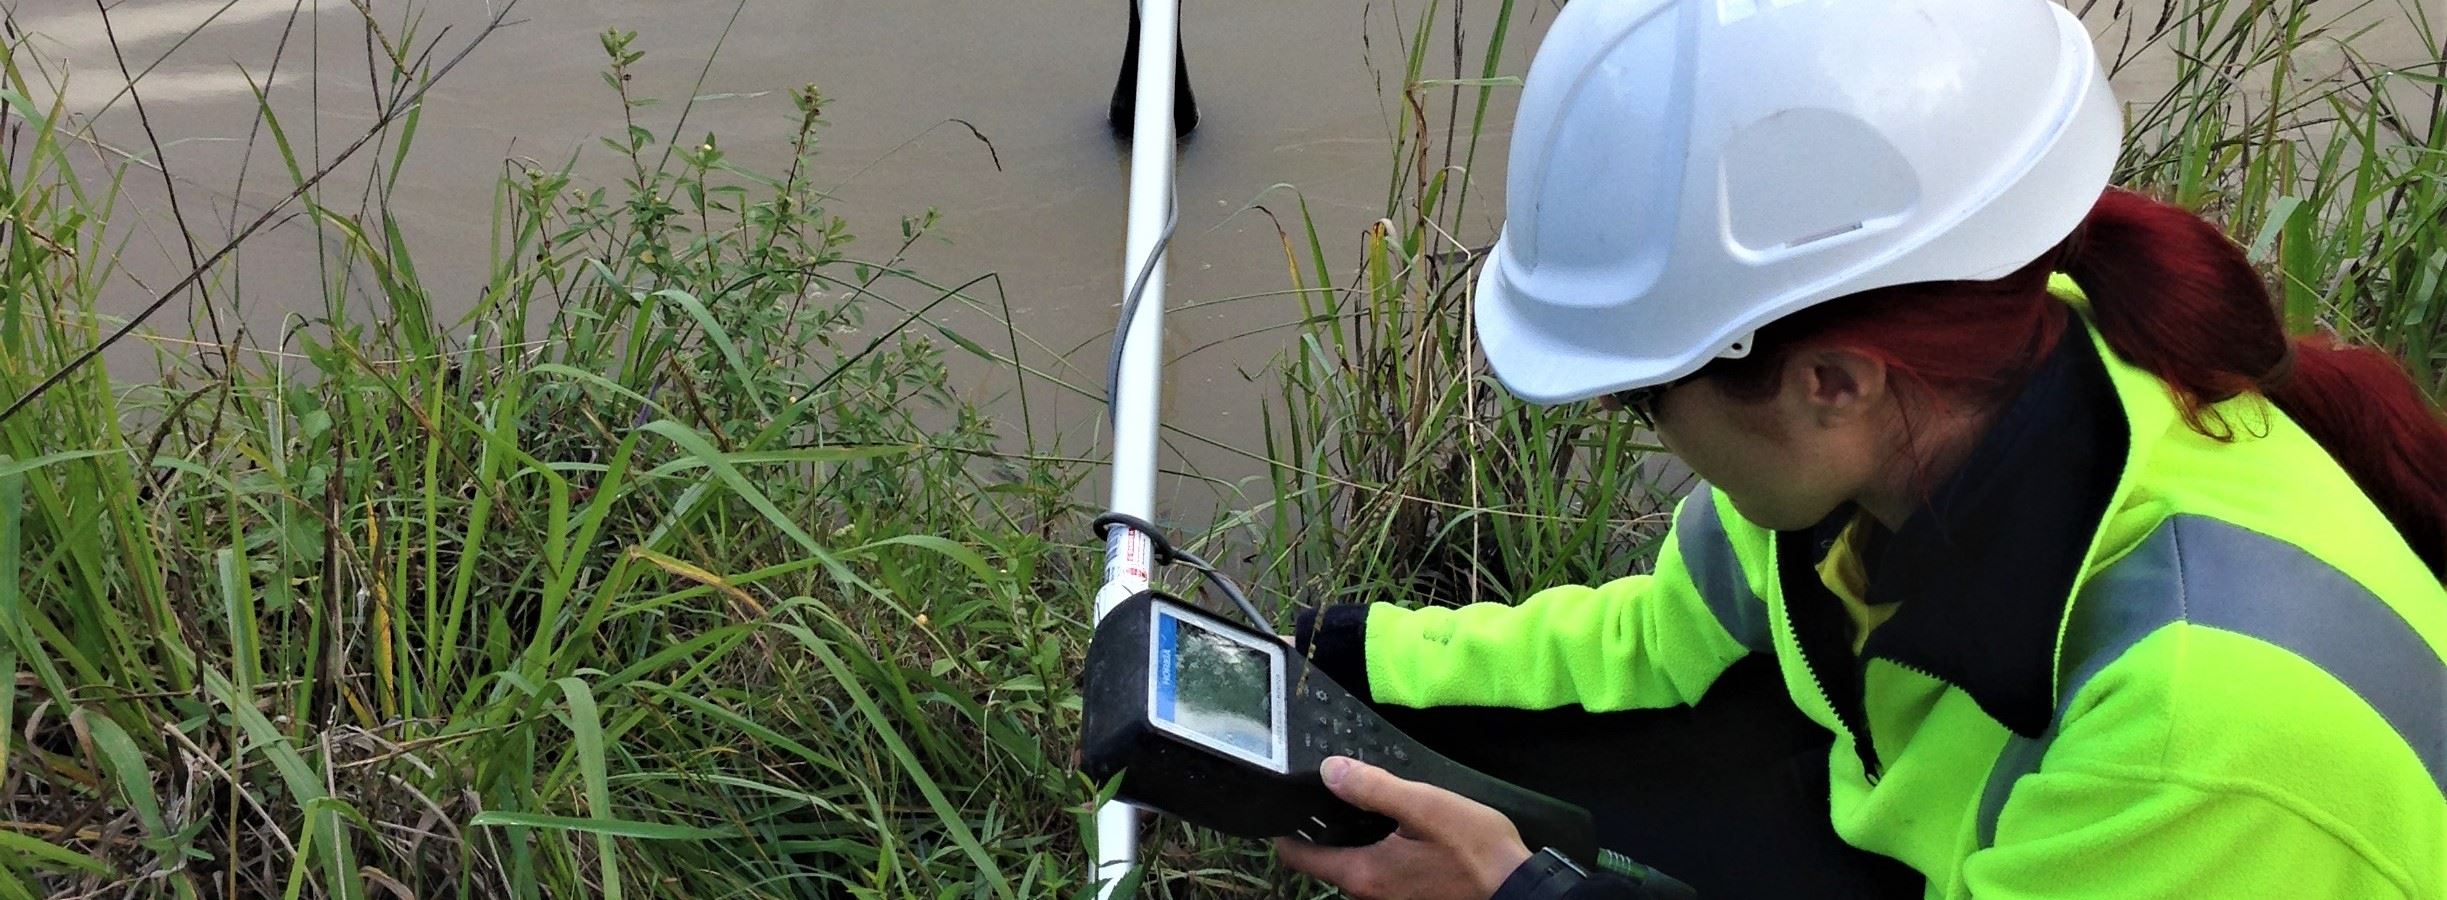
Field observations and field parameters are taken at the time of sample collection. Samples are collected used decontaminated containers and transferred into laboratory supplied sterile bottles. The samples are submitted to a NATA accredited laboratory and tested for the list of analytes required by the site Environment Protection Licence (EPL).
Analysis of sampling data is conducted by independent environmental consultants. The Development Application (DA 10/1319) Notice of Determination specifies water quality limits for some parameters, other are compared with site-specific trigger values, historical ranges, ANZECC or other appropriate guideline.
Known leachate indicating parameters are also compared against levels contained in site leachate to allow identification of any potential leachate impacts. A full discussion of those results is contained in the Facility's Annual Environmental Report.

Surface water monitoring results
- 2024 Surface water monitoring - December (PDF)
- 2024 Surface water monitoring - November (PDF)
- 2024 Surface water monitoring - October (PDF)
- 2024 Surface water monitoring - September (PDF)
- 2024 Surface water monitoring - August (PDF)
- 2024 Surface water monitoring - July (PDF)
- 2024 Surface water monitoring - June (PDF)
- 2024 Surface water monitoring - May (PDF)
- 2024 Surface water monitoring - April (PDF)
- 2024 Surface water monitoring - March (PDF)
- 2024 Surface water monitoring - February (PDF)
- 2024 Surface water monitoring - January (PDF)
- 2023 Surface water monitoring - December (PDF)
- 2023 Surface water monitoring - November (PDF)
- 2023 Surface water monitoring - October (PDF)
- 2023 Surface water monitoring - September (PDF)
- 2023 Surface water monitoring - August (PDF)
- 2023 Surface water monitoring - July (PDF)
- 2023 Surface water monitoring - June (PDF)
- 2023 Surface water monitoring - May (PDF)
- 2023 Surface water monitoring - April (PDF)
- 2023 Surface water monitoring - March (PDF)
- 2023 Surface water monitoring - February (PDF)
- 2023 Surface water monitoring - January (PDF)
- 2022 Surface water monitoring - December (PDF)
- 2022 Surface water monitoring - November (PDF)
- 2022 Surface water monitoring - October (PDF)
- 2022 Surface water monitoring - September (PDF)
- 2022 Surface water monitoring - August (PDF)
- 2022 Surface water monitoring - July (PDF)
- 2022 Surface water monitoring - June (PDF)
- 2022 Surface water monitoring - May (PDF)
- 2022 Surface water monitoring - April (PDF)
- 2022 Surface water monitoring - March (PDF)
- 2022 Surface water monitoring - February (PDF)
- 2022 Surface water monitoring - January (PDF)
- 2021 Surface water monitoring - December (PDF)
- 2021 Surface water monitoring - November (PDF)
- 2021 Surface water monitoring - October (PDF)
- 2021 Surface water monitoring - September (PDF)
- 2021 Surface water monitoring - August (PDF)
- 2021 Surface water monitoring - July (PDF)
- 2021 Surface water monitoring - June (PDF)
- 2021 Surface water monitoring - April (PDF)
- 2021 Surface water monitoring - March (PDF)
- 2021 Surface water monitoring - February (PDF)
- 2021 Surface water monitoring - January (PDF)
- 2020 Surface water monitoring - December (PDF)
- 2020 Surface water monitoring - November(PDF)
- 2020 Surface water monitoring - October (PDF)
- 2020 Surface water monitoring - September (PDF)
- 2020 Surface water monitoring - August (PDF)
- 2020 Surface water monitoring - July (PDF)
- 2020 Surface water monitoring - June (PDF)
- 2020 Surface water monitoring - May (PDF)
- 2020 Surface water monitoring - April (PDF)
- 2020 Surface water monitoring - March (PDF)
- 2020 Surface water monitoring - February (PDF)
- 2020 Surface water monitoring - January (PDF)
- 2019 Surface water monitoring - December (PDF)
- 2019 Surface water monitoring - November (PDF)
- 2019 Surface water monitoring - October (PDF)
- 2019 Surface water monitoring - September (PDF)
- 2019 Surface water monitoring - August (PDF)
- 2019 Surface water monitoring - July (PDF)
- 2019 Surface water monitoring - June (PDF)
- 2019 Surface water monitoring - May (PDF)
- 2019 Surface water monitoring - April (PDF)
- 2019 Surface water monitoring - March (PDF)
- 2019 Surface water monitoring - February (PDF)
- 2019 Surface water monitoring - January (PDF)
- 2018 Surface water monitoring - December (PDF)
- 2018 Surface water monitoring - November (PDF)
- 2018 Surface water monitoring - October (PDF)
- 2018 Surface water monitoring - September (PDF)
- 2018 Surface water monitoring - August (PDF)
- 2018 Surface water monitoring - July (PDF)
- 2018 Surface water monitoring - June (PDF)
- 2018 Surface water monitoring - May (PDF)
- 2018 Surface water monitoring - April (PDF)
- 2018 Surface water monitoring - March (PDF)
- 2018 Surface water monitoring - February (PDF)
- 2018 Surface water monitoring - January (PDF)


